Visualizing the Effects of Storms on The Puerto Rican Power Grid System
Context
Senior capstone project for the Human Centered Design & Engineering program at the University of Washington in collaboration with our sponsor, the Pacific Northwest National Laboratory (PNNL). My team consisted of 4 undergraduate UX designers, including myself.
Role:
UX Designer, Research Lead
Timeline:
January 2022 - June 2022
Problem Space
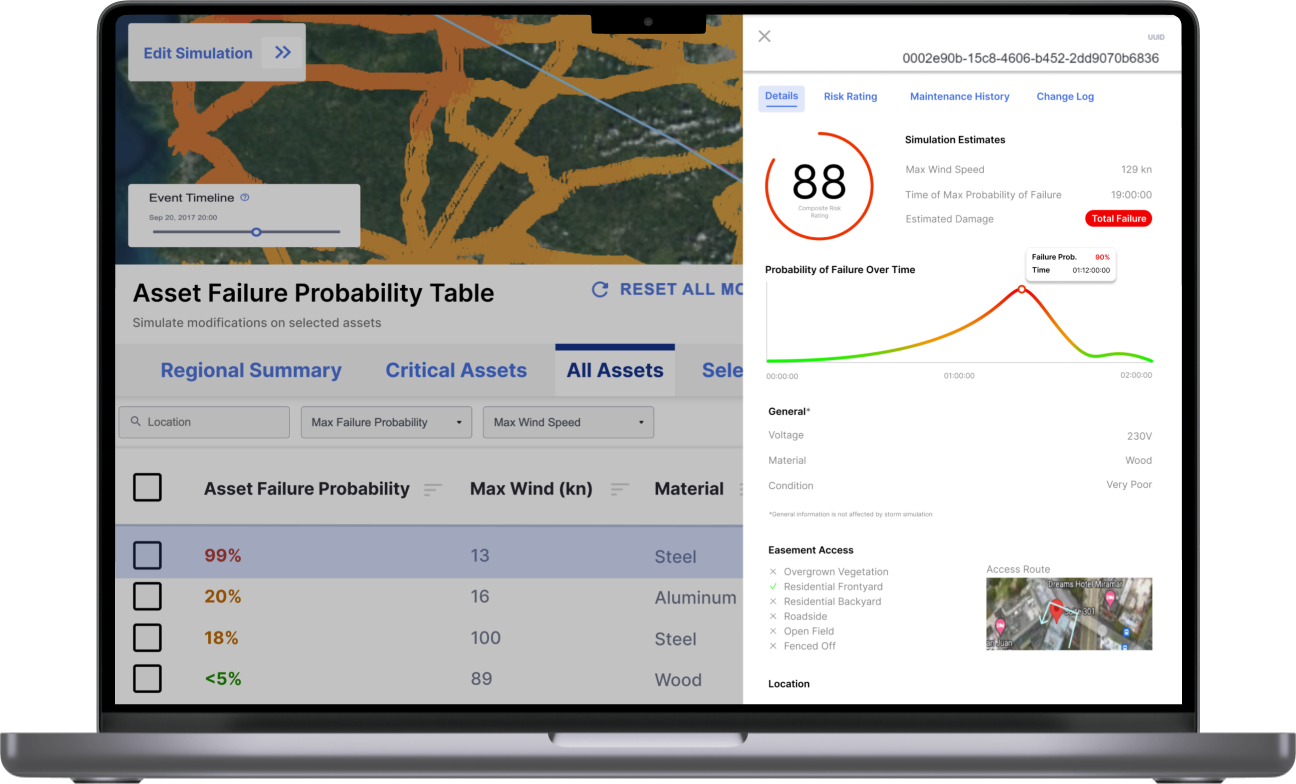
The Electrical Grid Resilience and Assessment System (EGRASS) is a web-based application that provides Puerto Rico with a storm simulation tool to aid in resource allocation. The main issue was that the application did not run on relevant data, and the Risk Analysis module had previously received feedback indicating it did not satisfy user needs.
The following research questions guided our focus:
How can we improve the usability of the Risk Analysis module for PNNL scientists, researchers, and federal staff?
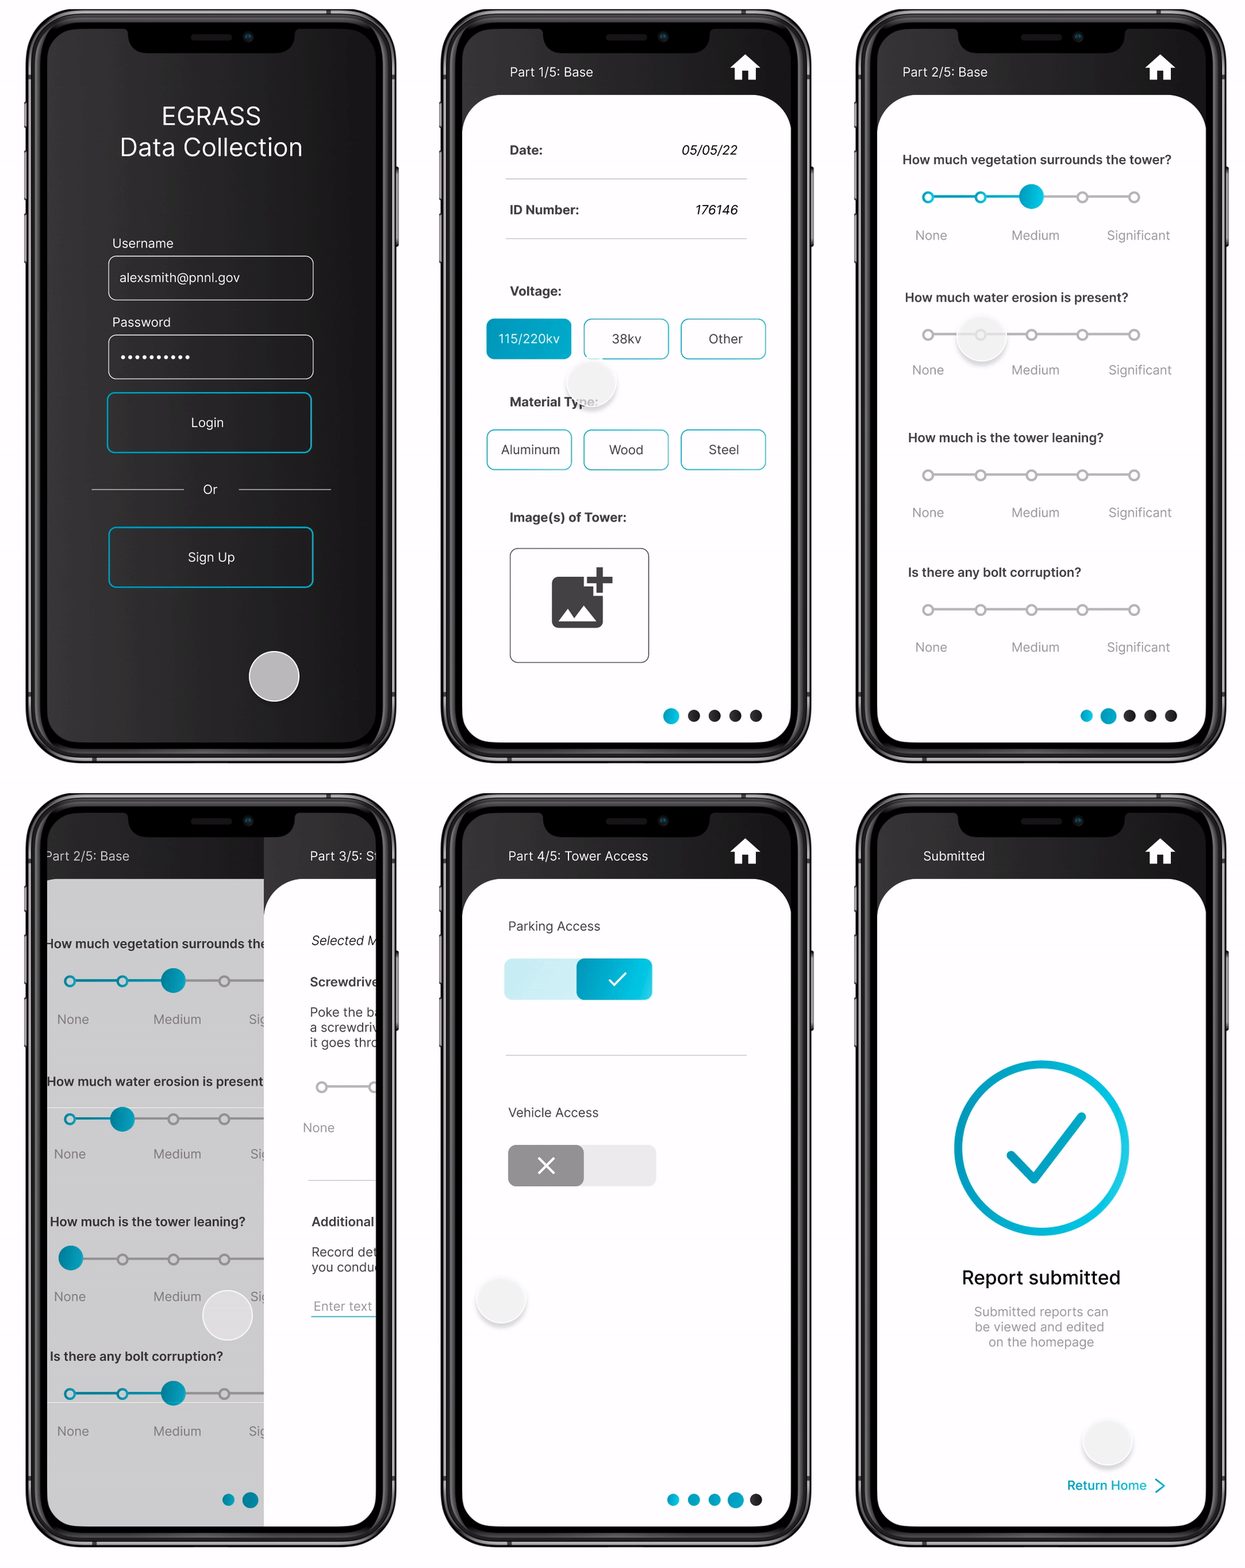
How can we design a data collection method for tower technicians to populate the Risk Analysis module?
1
2
Process
Note: This project started 12 weeks late due previous sponsor mishaps and issues with information clearance. This process occurred on a greatly condensed timeline but we persevered nonetheless!
Literature and Design Review
We did research on UX complex application design using articles primarily from the Nielson Norman group. We gathered insight into the space of non-linear task flows and how to design for them versus generalist applications which allow non-specialized users to follow linear task flows with clearly defined goals. We also reviewed articles on current usability best practices for web interfaces.
Looking at the Risk Analysis module together, we noticed some pain points of the storm simulation work space as novice users.
The work space was cramped and didn’t allow for a good view of the map
It was unclear what the asset risk tasting was based off of
Considerations
I dedicated time to learning about the people of Puerto Rico in an effort to understand what the impact of this project might mean. I learned about the hardships the people on the island face such as losing weeks of food due to lack of refrigeration and breaking expensive pieces of technology because their houses don’t have electricity. Hearing their stories, I recognized the important, necessary work that tools like EGRASS are in aiding the island’s residents to a future with a higher quality of life.
Interviews
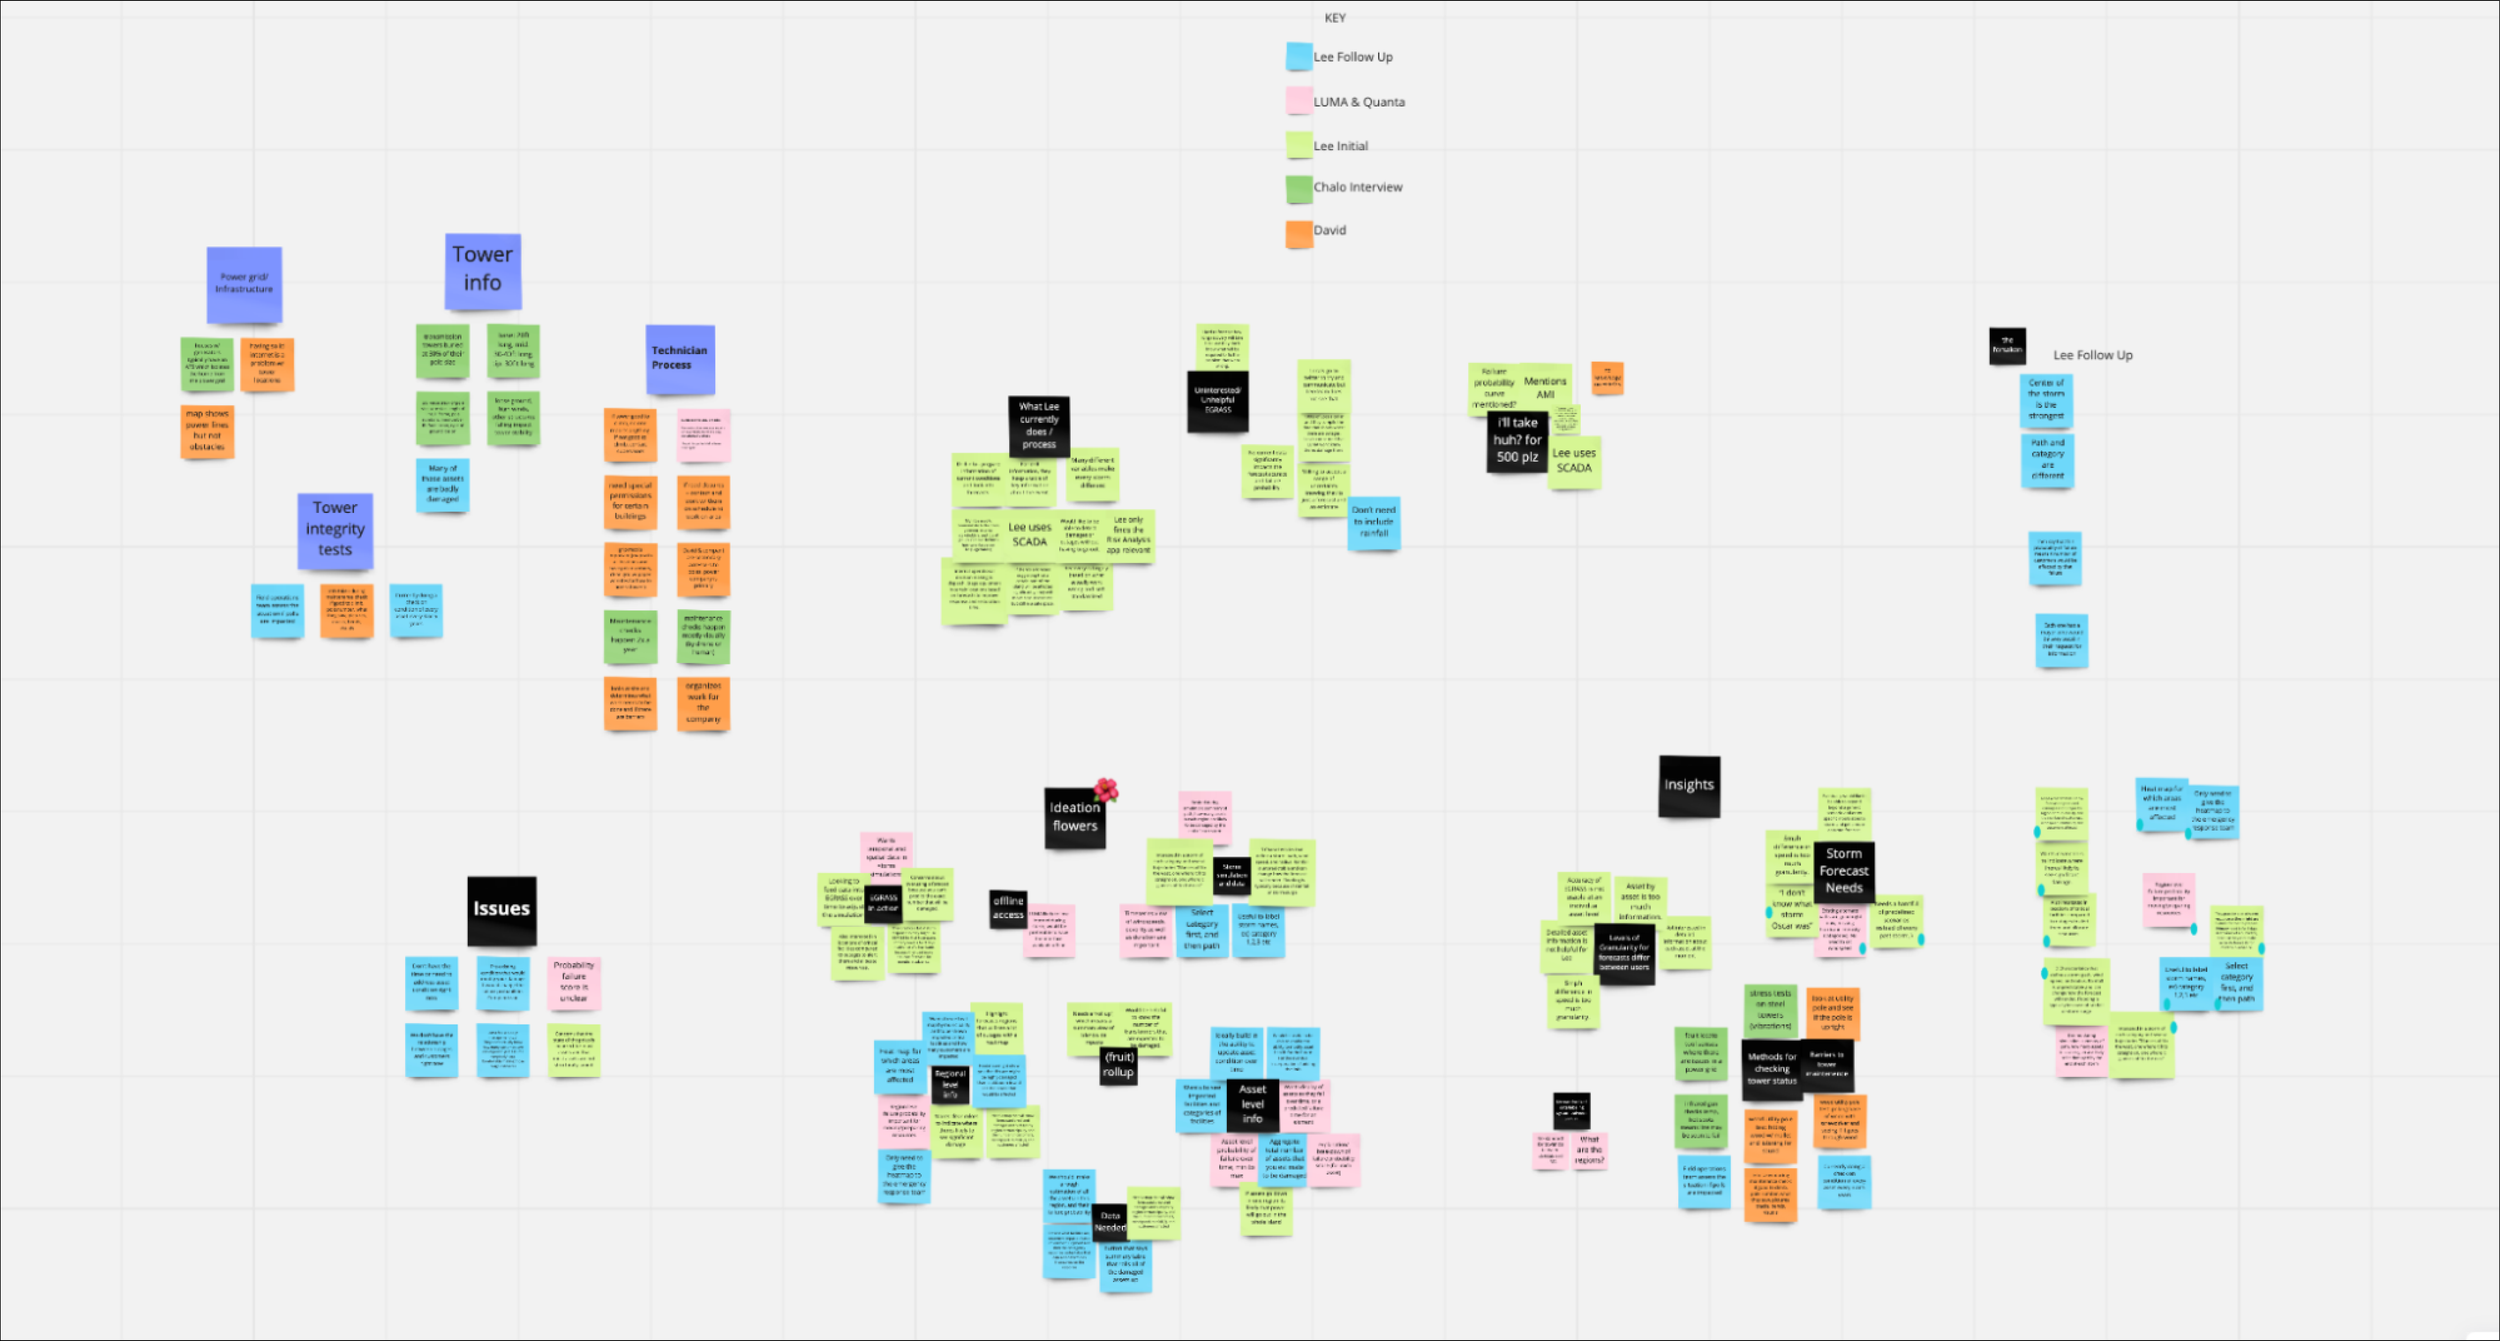
I lead my team through this research phase. To understand the needs of the Risk Analysis module users, we coded the interview transcripts provided by PNNL and affinity diagramed our findings. To understand the needs for a data collection system, I also conducted interviews with a transmission systems operator and a utility pole manager to understand the process of repairing and maintaining electrical towers. I researched various articles and videos of the tower maintenance check process in order to reinforce our knowledge.
Findings
Different users require different levels of information granularity
Users need options for storm simulation set up
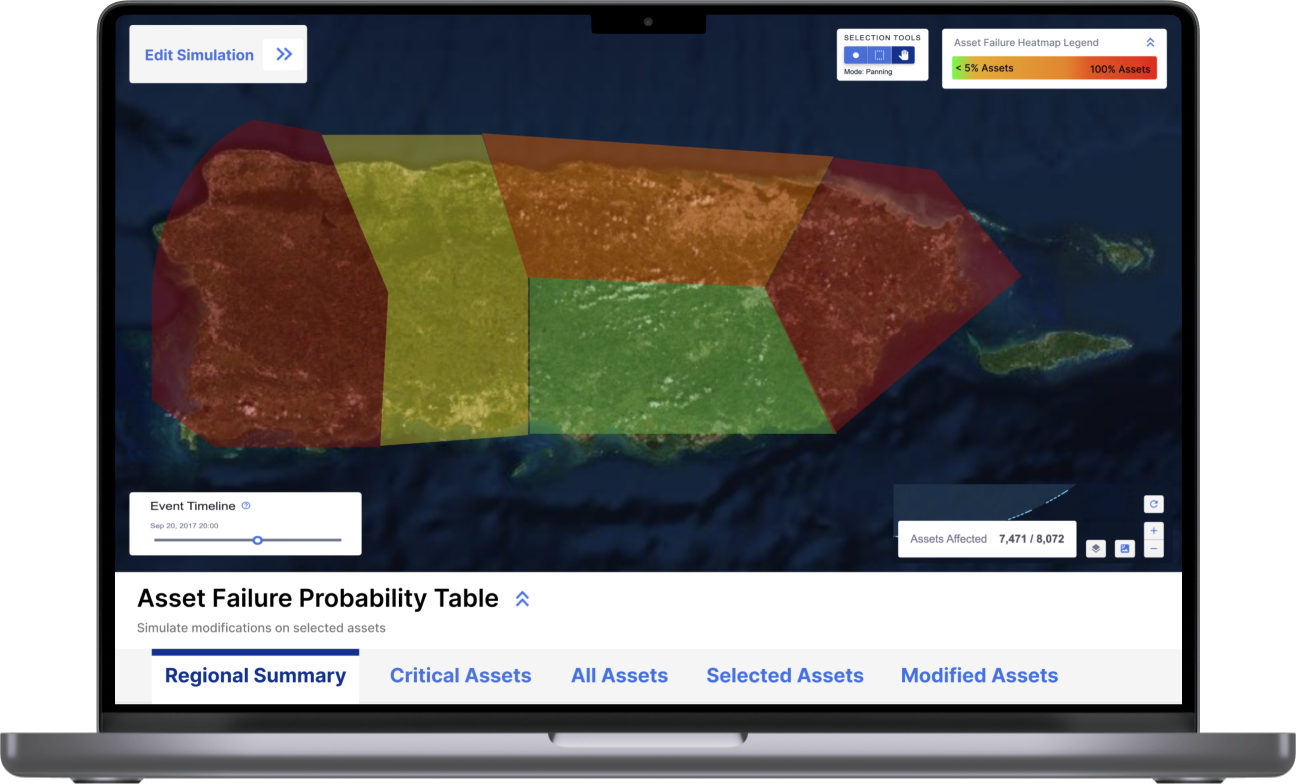
Heatmap visualization would be useful
Miro board coding interviews and tower maintenance research
Risk Analysis module
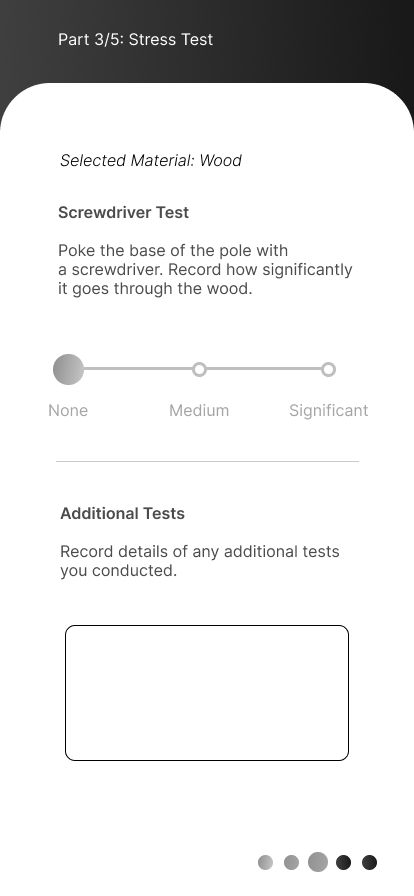
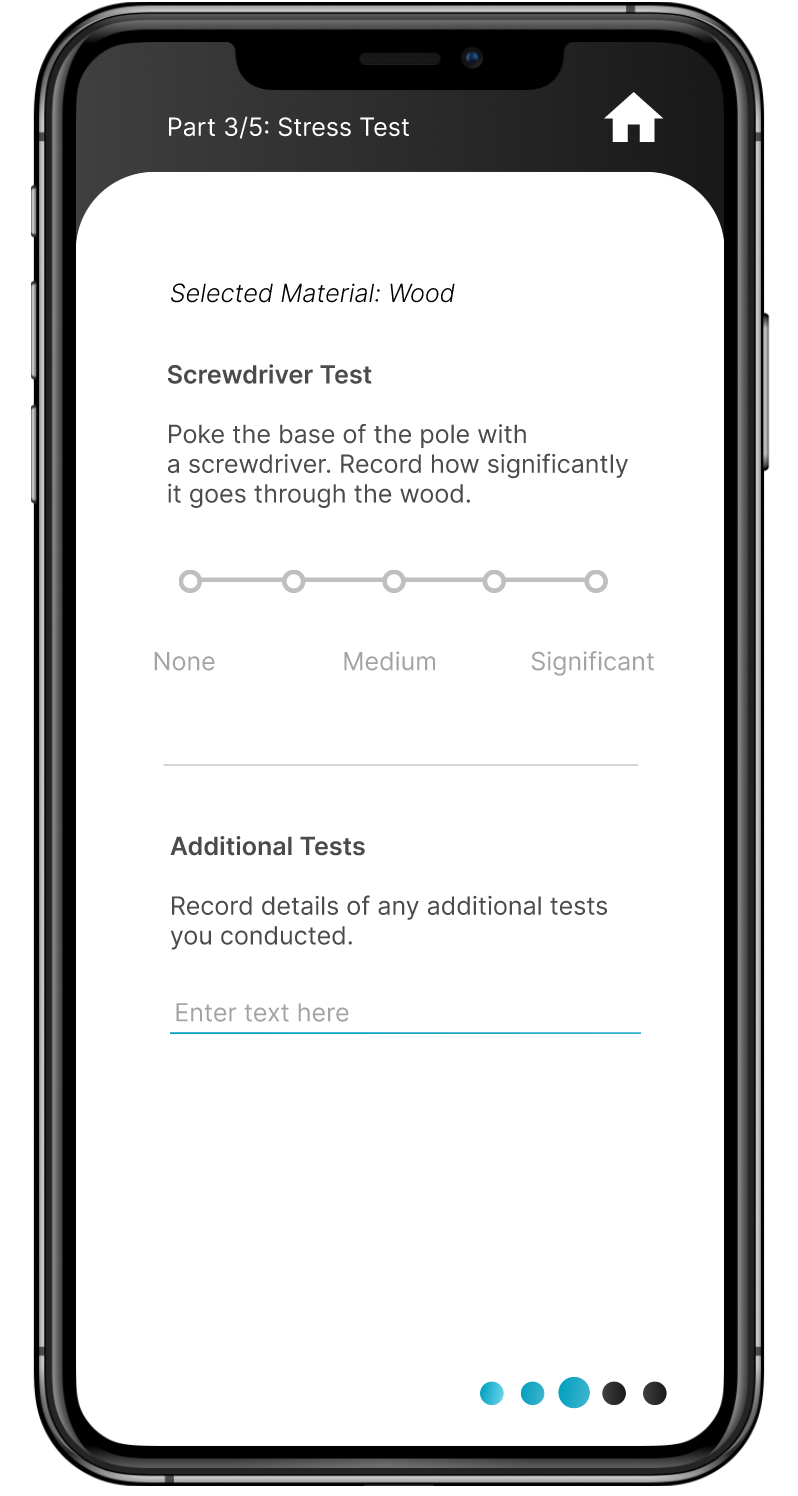
Various stress tests can determine stability of a tower
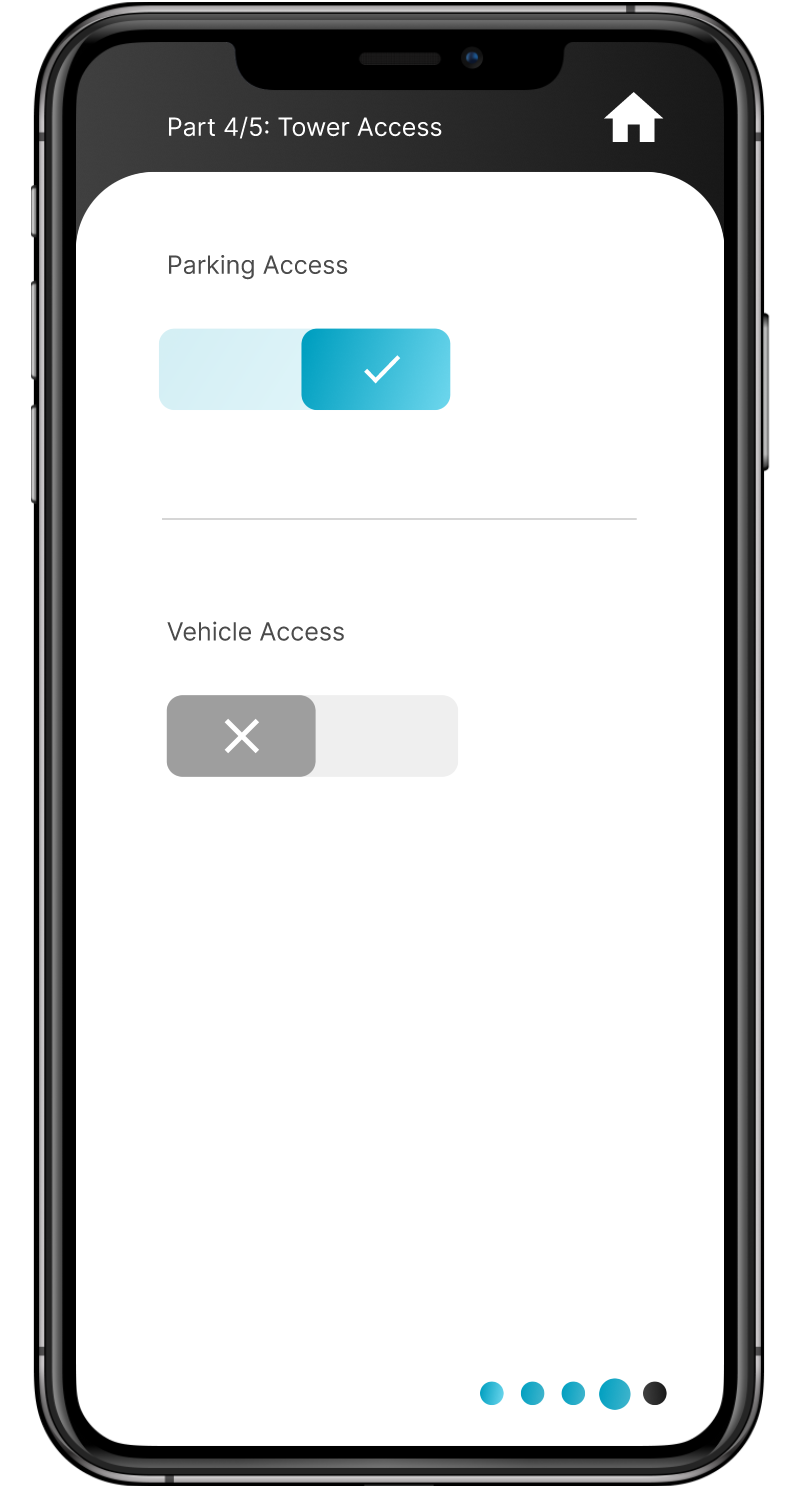
Tower data can be collected from multiple parts of tower
Data Collection app
Ideation
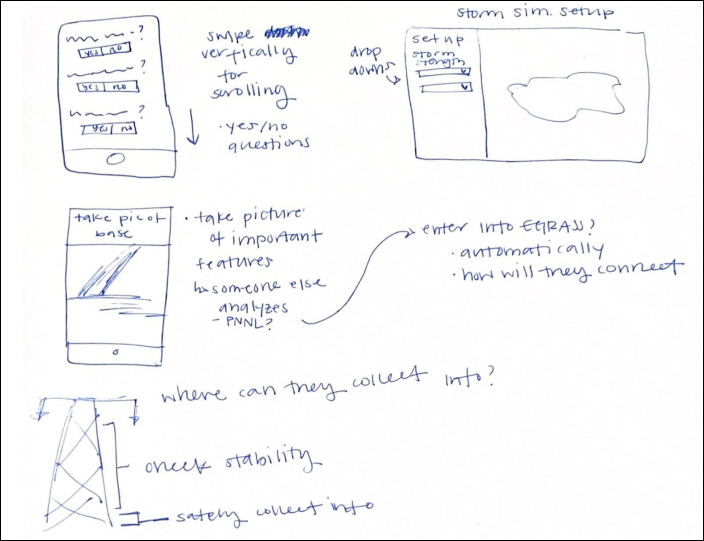
Each team member completed an individual ideation session. I focused on features like data entry and thinking about the process of data collection
Sketching
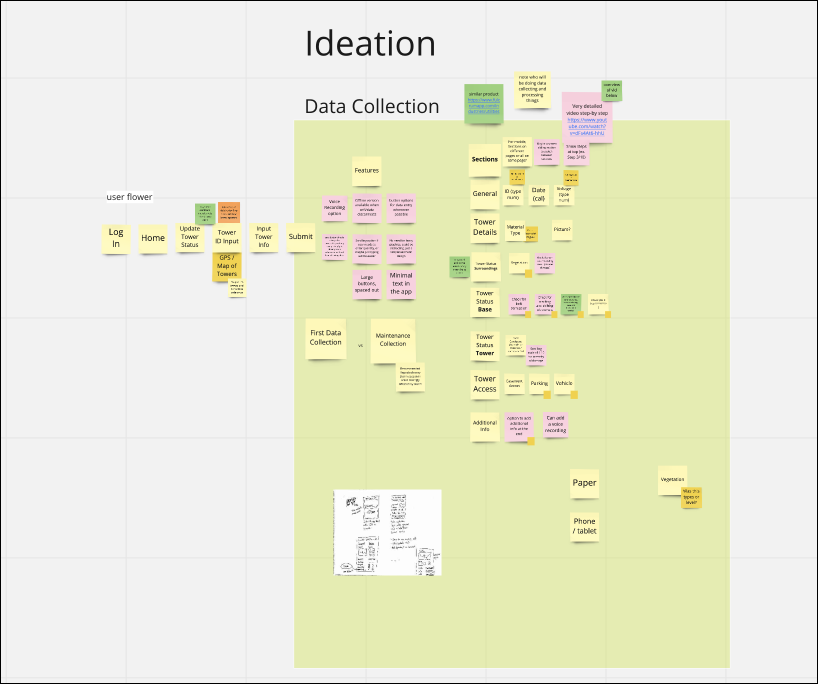
Brainstorming
We used Miro to compile our ideas and decided with key elements our products should have.
Key Elements
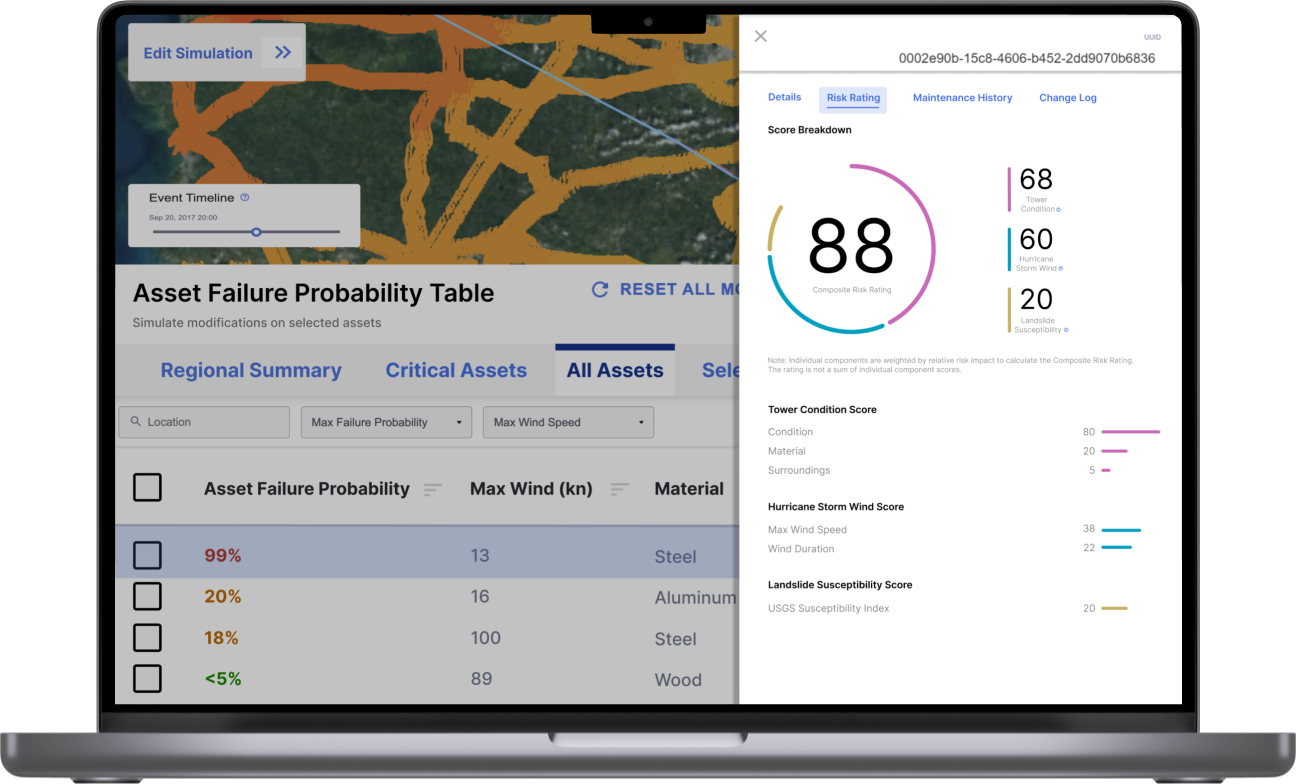
Asset Details: displays asset-level information
Risk Rating: provides transparency on the probability of failure
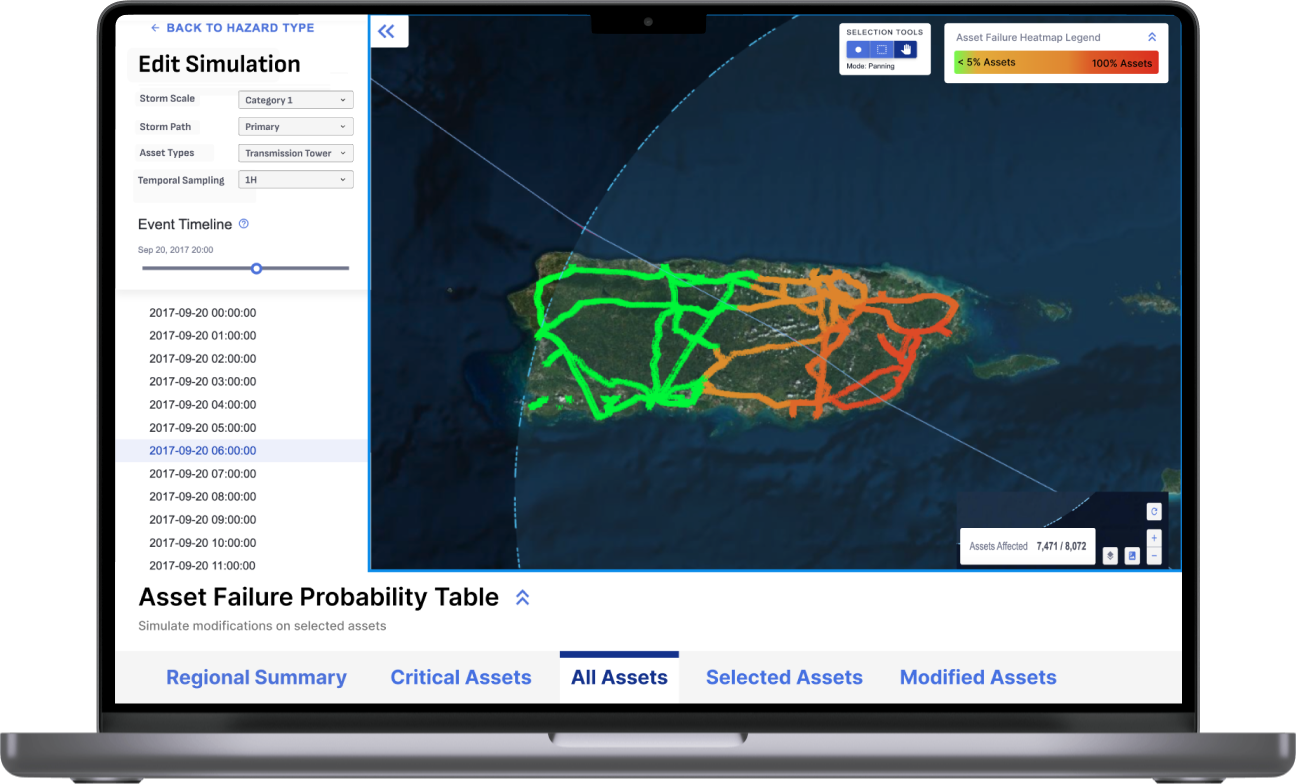
Simulation Selection: ability to select storm intensity and storm path when manipulating simulation
Table and Map Layout: adjustments to table and map allow larger map view
Table Elements: access to regional-level summaries and individual asset status
Risk Analysis module
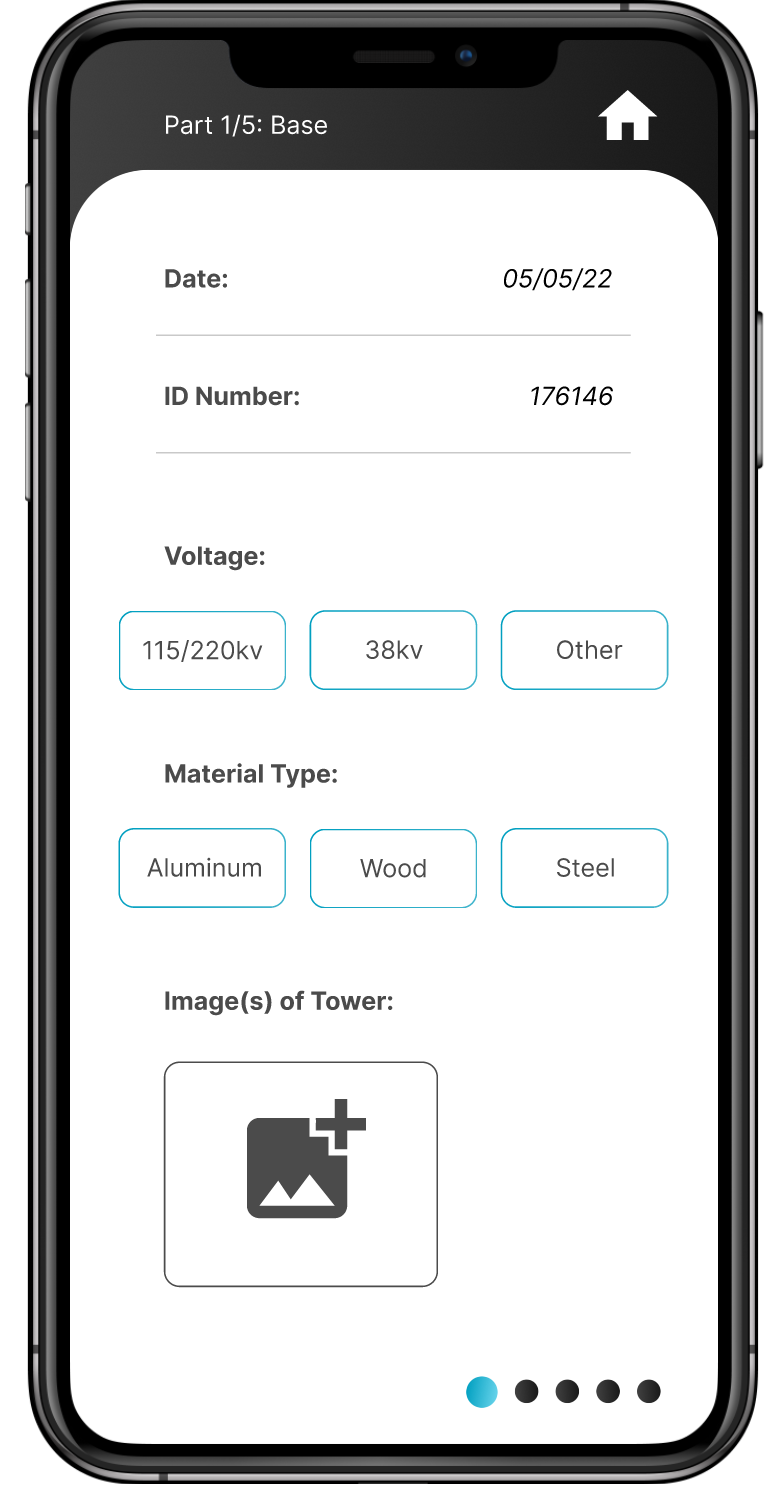
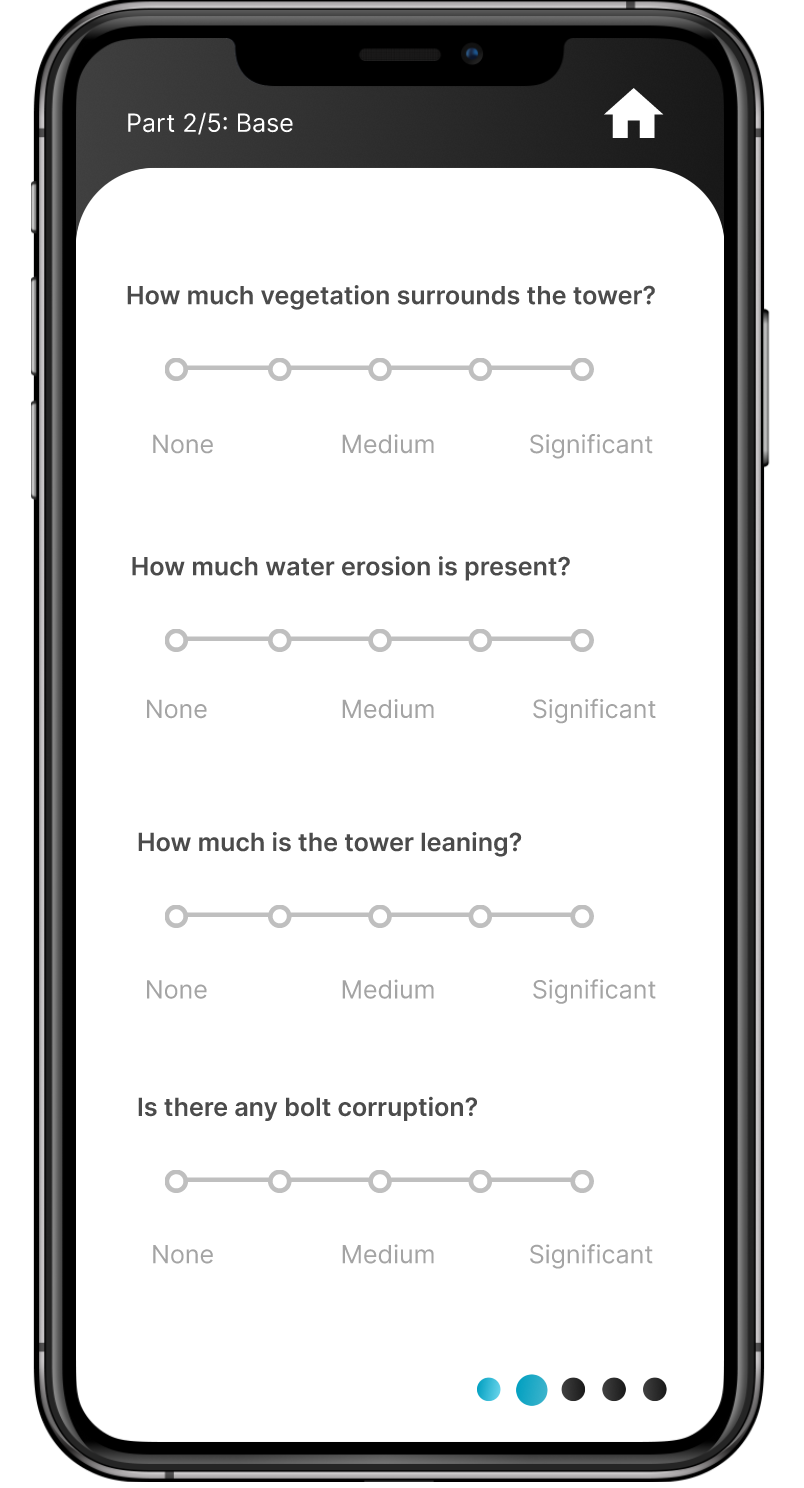
Asset and Surrounding Conditions: report the general state of the transmission tower.
Stress Tests: report the results of stress test according to material
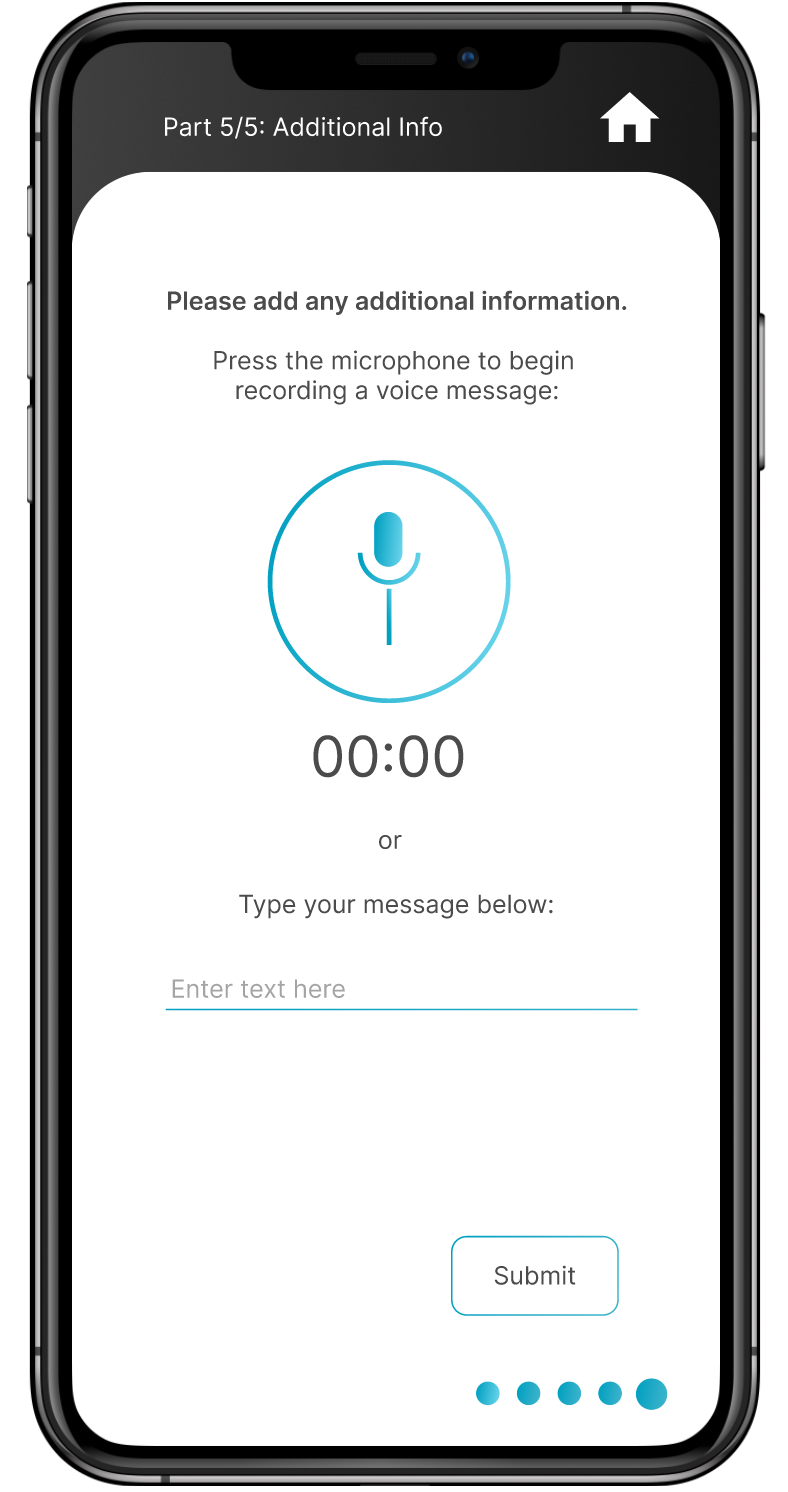
Voice Notes: ability to report additional information, chosen over writing for ease.
Compatibility with gloves and offline: swiping features and ability to be used without phone service accommodates users
Data Collection app
Wireframes
We made wireframes for both our products to get an idea of layout and mobile app navigation
Feedback
After presenting our wireframes to the PNNL development team, we received the following feedback:
Risk Analysis module
Consider resolution and screen size
Include edge cases such as the numbers 100 or 1 for font size and formatting
Think about loading time with simulation editing
Data Collection app
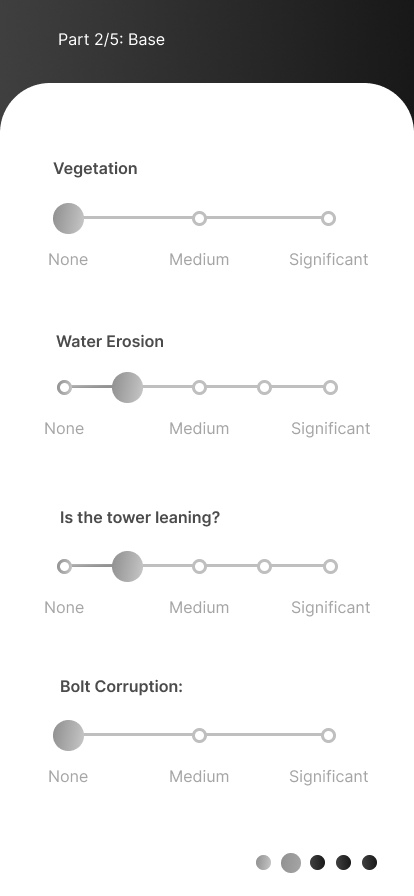
Add more granularity with the slider options
Final Prototypes
We iterated on our designs according to the dev teams feedback and produced our final prototypes!
Risk Analysis Module Redesign
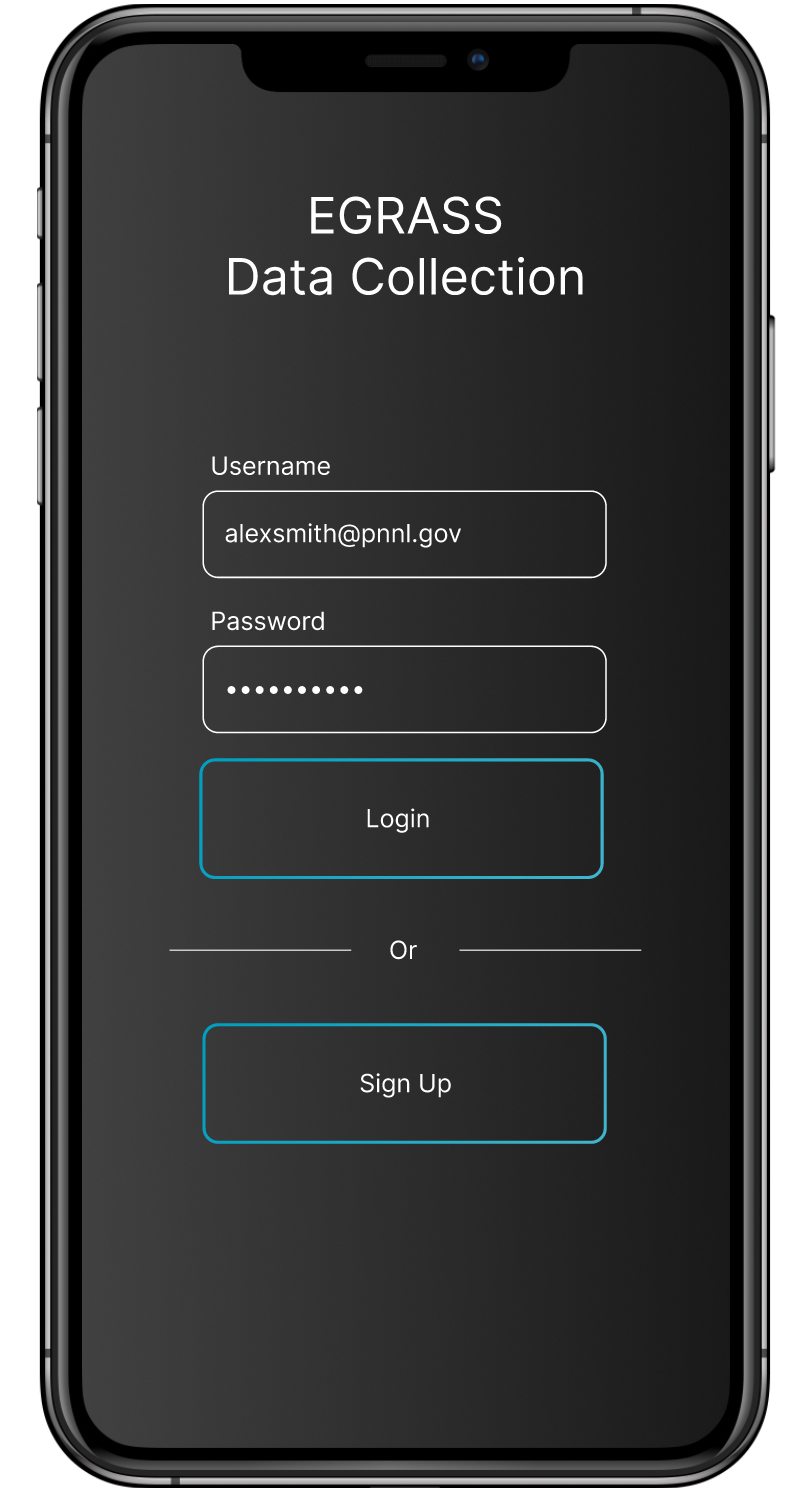
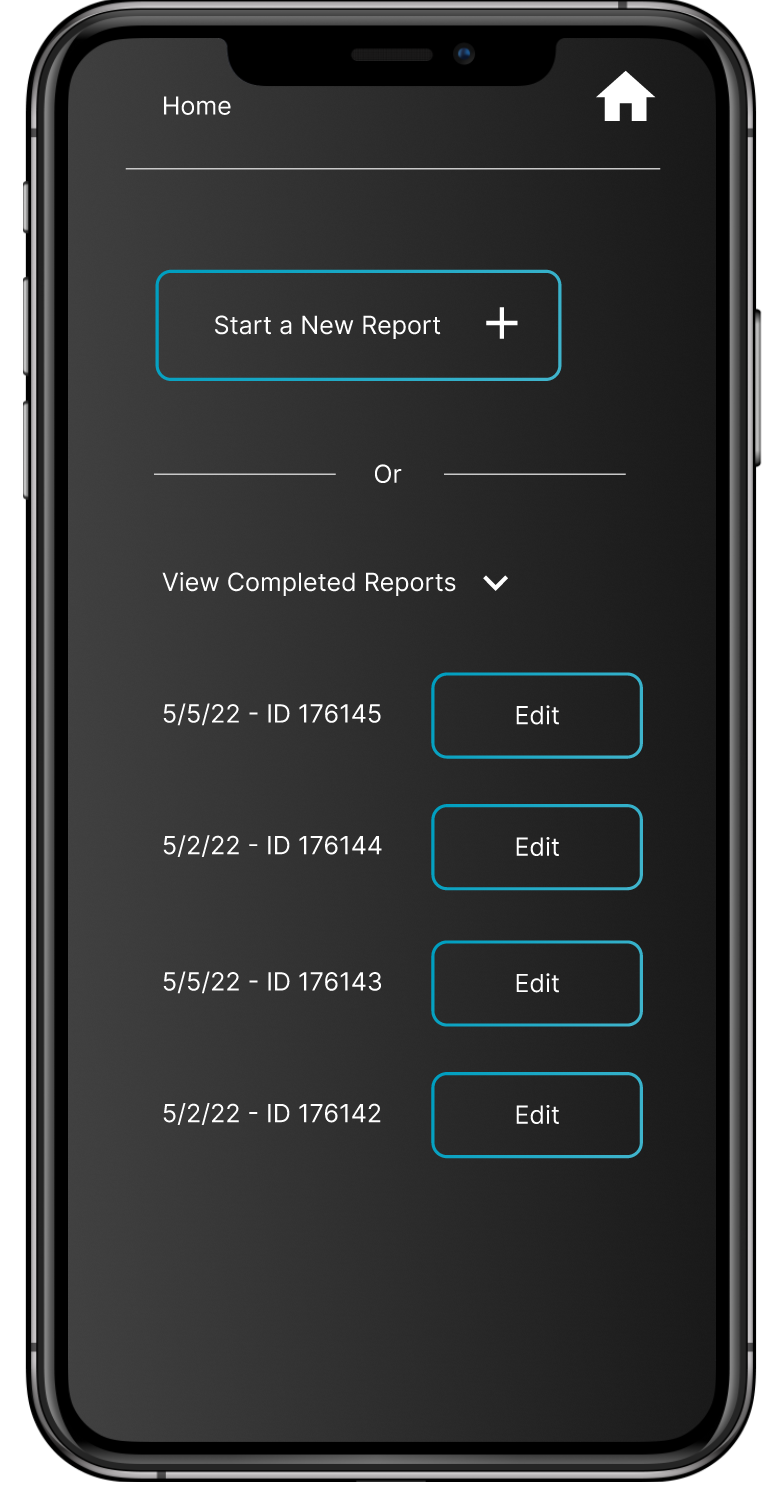
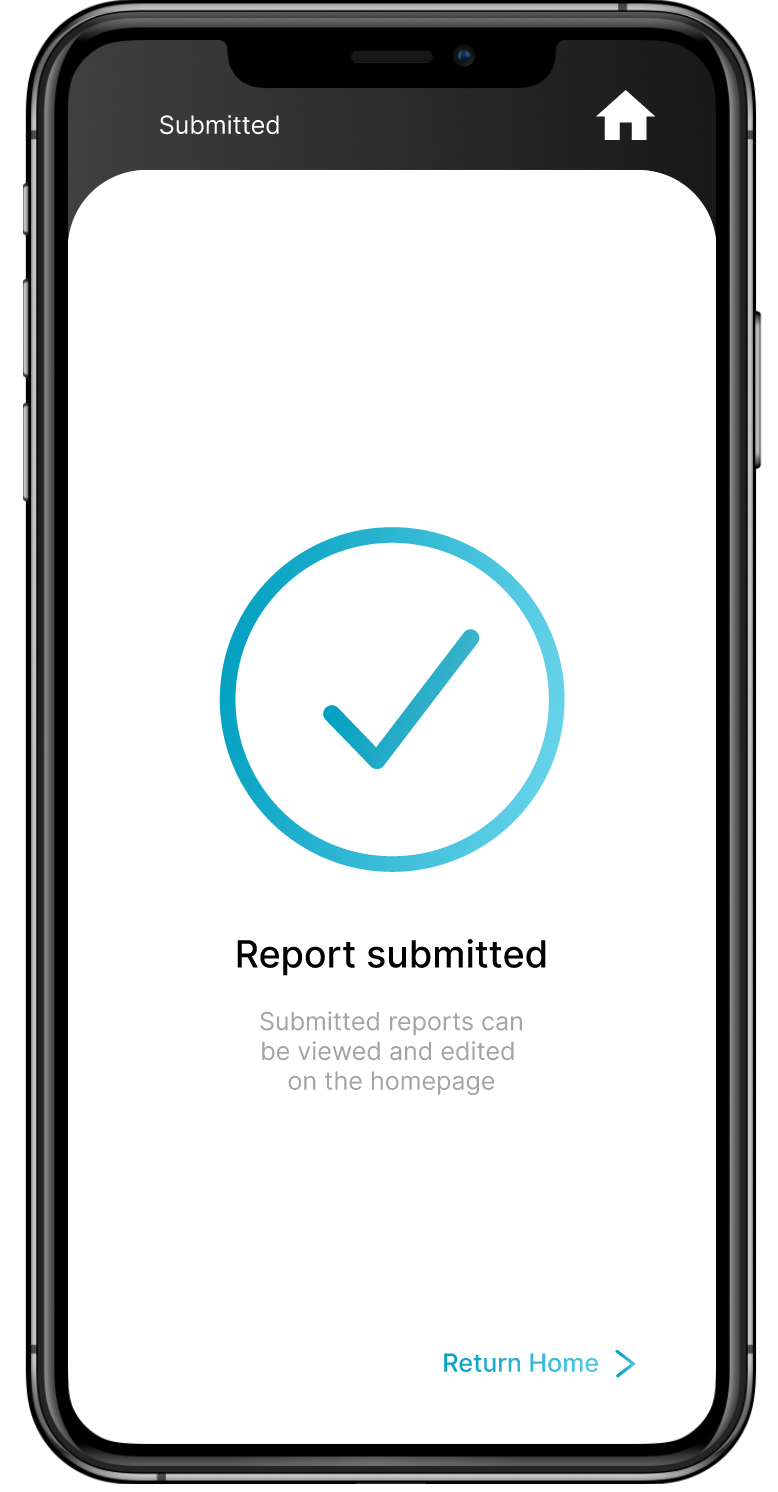
Data Collection Mobile App
Reflection
This project allowed me to explore a space I was unfamiliar with. It was fascinating to work with complex application design as it forced me to think more deeply about the context. I expanded my knowledge on power infrastructure, power grids, electrical towers, and tower inspections which were all important to deal with the problem space. I also appreciated learning more about the stories of Puerto Ricans suffering as a result of the power grid’s instability. I hope that work like this is taking steps towards a better response to the island’s catastrophic outages.
It was important to me while working on this project to always have the workers of Puerto Rico’s power grid in mind. As they would ultimately be the ones interacting with the data collection mobile app. One aspect that I wish we could have done is interview Puerto Rican tower technicians and better understand their process when maintaining the power grid in the islands natural environment. Another detail I would iterate on is to make a version of the app with the text in Spanish. I would also consider the Puerto Rican cultural dimensions and design principles to adjust our American visual design accordingly.
This project also made me appreciate teamwork like no other experience has. Many unforeseen issues condensed our timeline immensely. I am extremely grateful to my capstone team who provided me with invaluable support and took the challenges with perseverance. As a whole, this project was difficult but extremely rewarding.


